

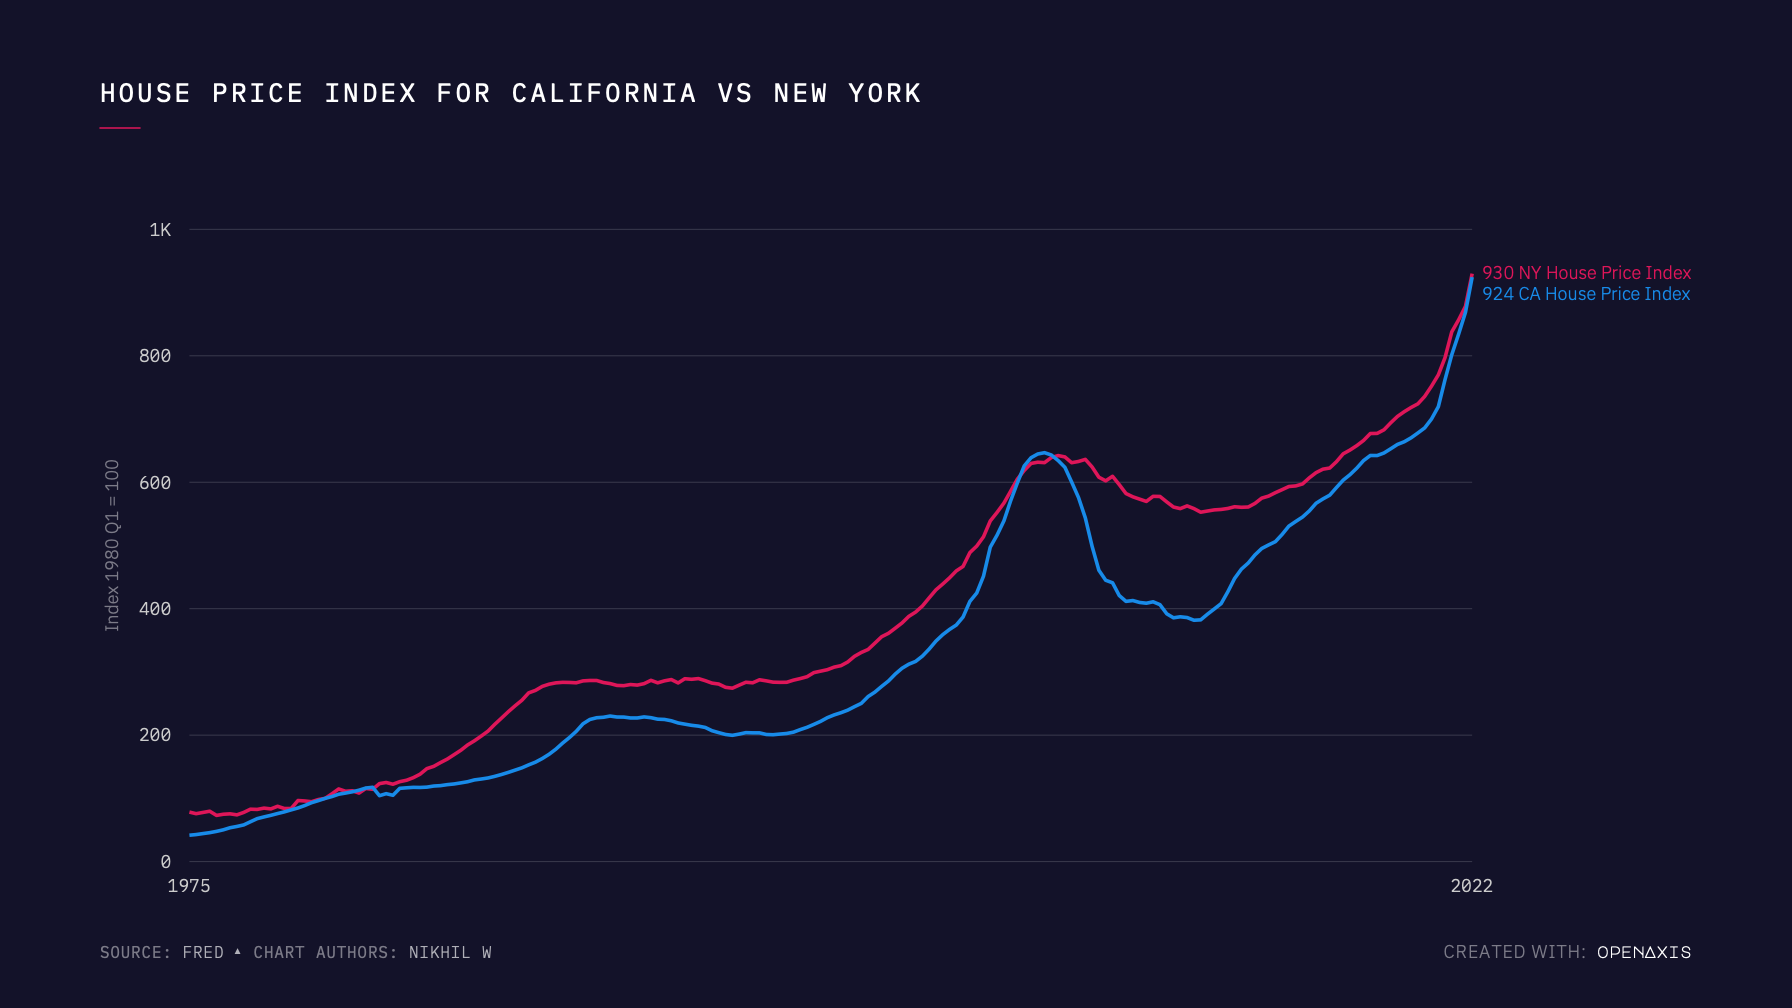
I created this chart to understand the correlation between New York and California House Price Index Over Time. Clearly, both indices follow a very similar trend line of growth over a long term period. What I found interesting was the noticeable discrepancy in trend lines between the years 2007 and 2017. Both indices dip for that period, but it seems like California's dip is much more pronounced than NY's. What do you think explains this discrepancy?
Interesting to see CA and NY, the most expensive housing markets in the US, track each other pretty closely over the past 50 years.
You can see the peak right before the financial crisis in 2008. Wonder why CA corrected more than NY, and now we're at the highest levels recorded.
What other data could we look at to better understand the dynamics at play here!